Optimising an AWS microservice - Part 2
In my last post I talked about our latest project in Sky Bet’s Trading Models Squad to decrease the latency of our new RequestABet™️ pricing service as we aim to hit our non-functional requirement of 100ms latency at the 95th percentile. At the end of part 1 we found out that we weren’t as fast as we had first thought and were still some way off our target, despite having made several performance improvements.
Back at the drawing board…
Upon realising we still had a lot of ground to make up we set about doing some analysis. We wanted to find out more about our system and which parts of it are making up the most time so that we know where to focus our efforts.
Enter AWS X-Ray!
To help us with our analysis, we turned to AWS X-Ray. X-Ray is a tracing system provided by AWS that helps you map requests as they flow through your system. You can then pull out slow requests and analyse how long they are spending in each component of your service – or even more granular than that you can use the X-Ray SDK to track how long particular sections of your code are taking to execute within each application.
Here is an example of a typical ‘slow’ request:
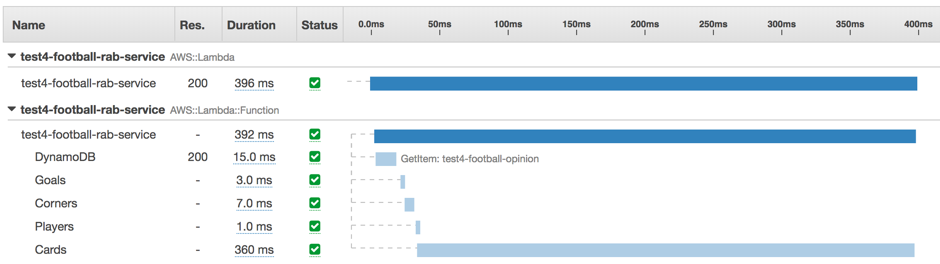
As you can see, we’ve split the execution times in our Lambda function into the interaction with DynamoDB, and then into the different parts of our pricing model. In this particular example, we’re spending 360ms calculating the Cards section of the model, whereas everything else is really fast.
Our conclusion was that the slow requests were ones that were missing the in-memory caching implemented in our pricing model, forcing it to run large calculations from scratch. These cache misses were happening too often and this was pushing our 95th percentile latency up.
Caching in AWS Lambda
Our focus then turned to the caching that we had implemented in our pricing model. Why wasn’t our caching getting used as much as we had expected? Why did we see fewer cache hits as we scaled the number of requests we made?
The answer to these questions lies in how AWS Lambda works under the hood. When you invoke a Lambda function, AWS provisions a container and loads your function with all of the necessary resources for it to run. If you invoke the same function again a short time after, there’s a good chance that the first container will get reused, so any state cached in memory from the first invocation can still be accessed.
However, you can’t guarantee every time you invoke your Lambda that it will get processed by the same container. As you scale traffic up, AWS provisions more containers for your Lambda so that it can process your executions in parallel. At any given time, you don’t know how many containers are in your ‘resource pool’; AWS just provisions however many you need based on traffic levels.
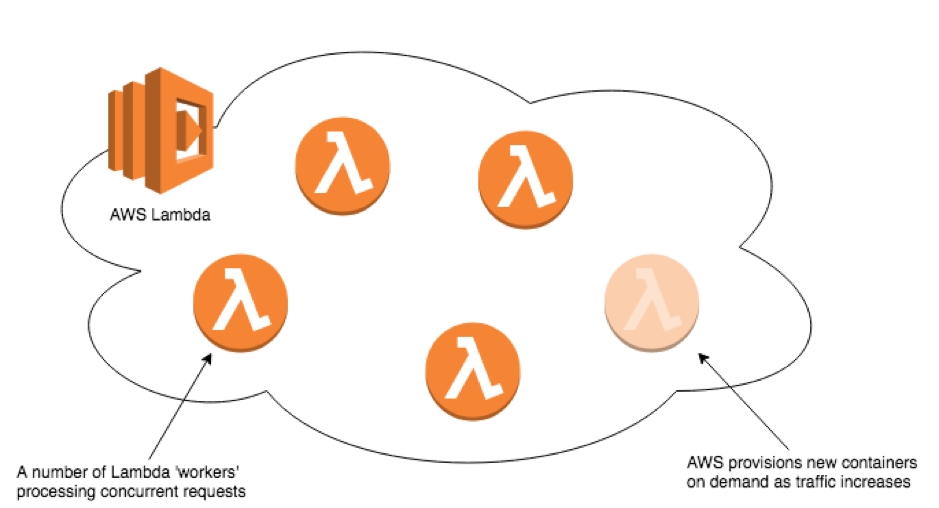
The containers in the pool run independently without shared memory so if we cache something in one then we won’t know about it in another. Therefore, as traffic goes up and we are provisioned more containers, in-memory caching becomes less effective and the amount of processing we have to do increases.
AWS ElastiCache to the rescue!
We decided to try out ElastiCache as a solution to our caching problems – AWS’s fully managed, highly scalable caching service. The main idea here is that instead of caching our model outputs within the application itself, we store them in a shared memory store so that every Lambda container has the same state:
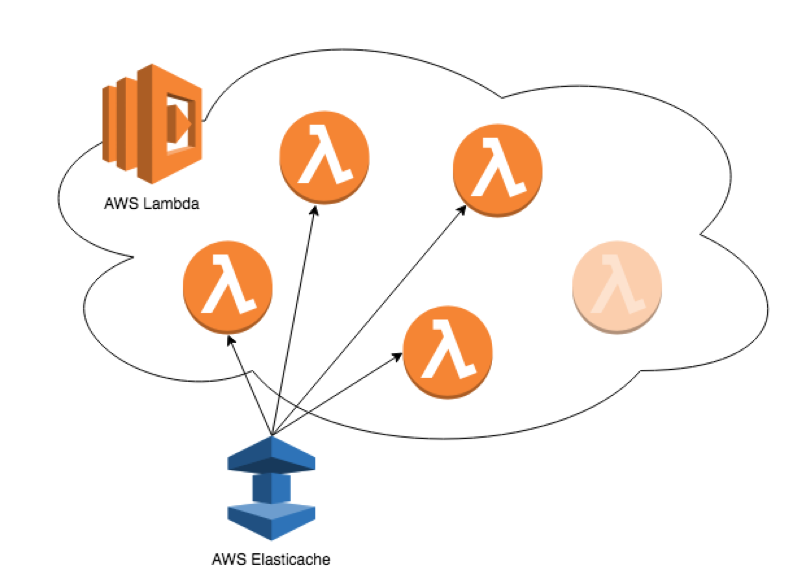
We found that this suited our purpose far better and it drastically reduced the amount of processing required by our Lambda function. In fact, it took us almost all the way down to our 100ms latency target, hurrah! There were however a few issues that we had to consider when integrating our nice new cache:
Serialisation times can be a killer!
In order to write a java object to an external cache, you need to serialise it. For our initial implementation of this we serialised our model outputs to JSON strings and began storing them in our cache. We then ran our first performance test and the results were horrible! A quick look at our X-Ray traces shows why:
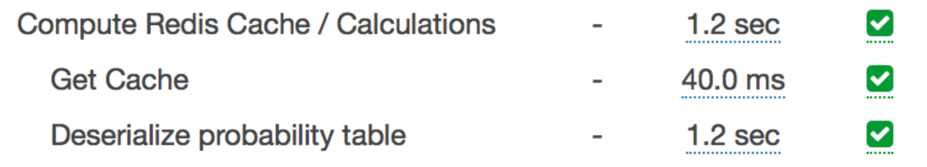
It turns out that serialising and deserialising large Java objects to JSON is slooooow! After a brief panic, we revisited our code and instead implemented Java’s default JVM serialisation, storing our data as raw bytecode. We reran the test and this is what we got:
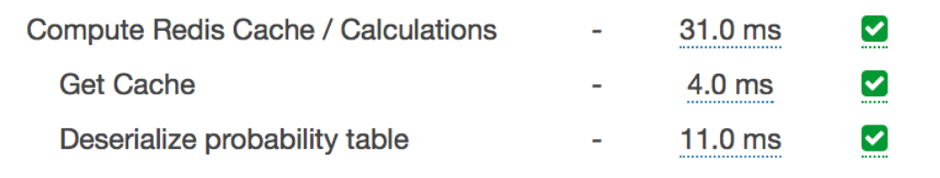
Much nicer :)
Elasticache requires Lambdas to run within a VPC
In order for your Lambdas to have access to an ElastiCache they need to be hosted within the same VPC, or Virtual Private Cloud. This is effectively where AWS gives you your own dedicated IP space for your resources to run in. You need to consider a couple of things when running a Lambda in a VPC:
Make sure you have enough IP space for your Lambda to scale!
As mentioned earlier, AWS Lambda provisions new containers as it scales out to cope with concurrent executions. One thing worth noting here is that every time a new container is provisioned, it needs to assign itself to an IP. If you haven’t given yourself a wide enough range of IP addresses then you could end up throttling yourself so be careful!
Lambda cold starts are much worse within a VPC
Lambdas are infamous for their ‘cold starts’. This is where processing times are significantly slower whilst you are waiting for a new container to load up. This is something that we have seen in production before so we have a ‘keep warm’ function set up that regularly sends dummy requests to our service to ensure that our Lambda is always ready to go. If you see large bursts in traffic on a warm Lambda then it is still possible to see more cold starts as it scales up, but in the past we’ve just accepted the risk of the occasional 1 second response time. However, we had read about cold starts being worse when your Lambda is within a VPC and this is something that we have seen, with occasional 20 second response times from a completely cold Lambda. An interesting article on why this happens can be found here but the gist of it is that it takes longer for your containers to be assigned an IP: About Lambda VPC Cold Starts
For now, we expect that our keep warm function is good enough to avoid these horrible cold starts but it’s definitely something for us to look out for when we go live to real customer traffic.
A VPC benefit – we can now use DAX on our DynamoDB
One of the good things about our new VPC is that it allows us to get the benefits of another AWS caching service, Amazon DynamoDB Accelerator (DAX). DAX puts an in-memory cache in front of your DynamoDB that delivers up to a 10x performance improvement: About DynamoDB Accelerator
We couldn’t use this before because it requires anything that needs access to the DB to be sat within a VPC, but now we have one we might as well get those added benefits too. Anything to shave off those pesky milliseconds!
The results are in…
After adding our improved caching, we reran our test and our latest 95th percentile latency is… 92ms! A 70% decrease on our baseline of 320ms.
AWS X-Ray provides latency histogram data that can be accessed via the AWS CLI. Here’s a before and after chart of our internal system latency:
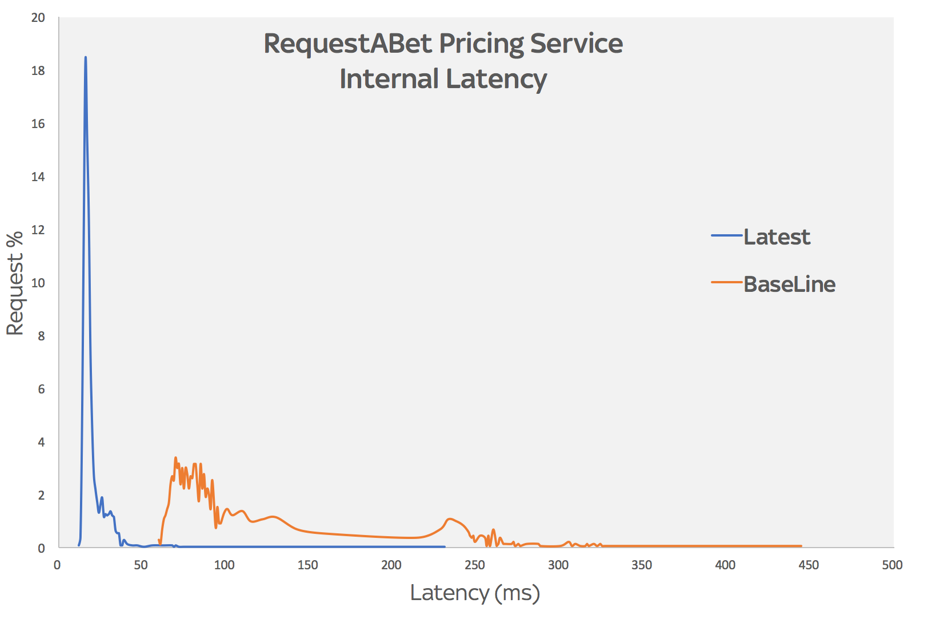
As well as being generally a lot faster than before, our request times are also much more consistent, and we’ve improved the long tail that we were seeing before – our maximum request time on the new test is roughly half of the max on the old one.
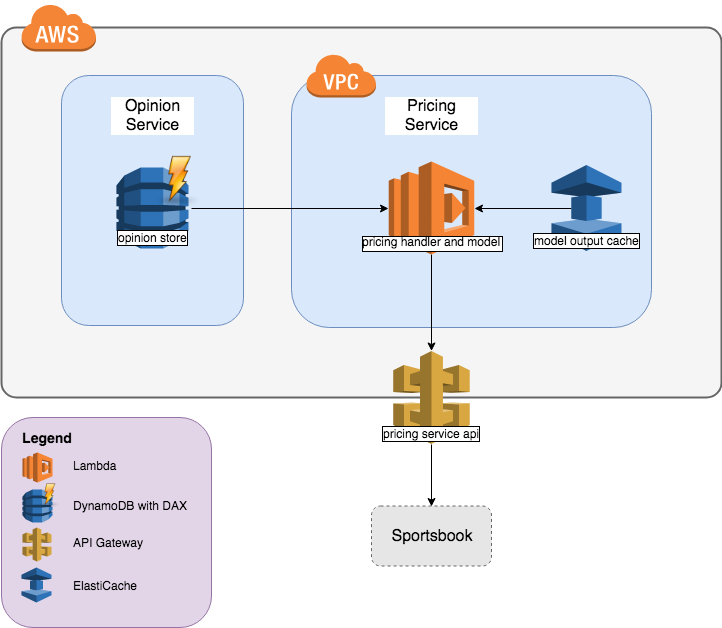
It’s been a busy few weeks of optimising and we’ve learnt a lot about AWS along the way. After increasing our CPU, removing unnecessary components boundaries, streamlining our authentication, improving our java packaging, implementing ElastiCache and DAX, we finally have our latest system design:
Key takeaways on optimising a service in AWS:
- Understand and question your requirements – are they realistic?
- Make sure your performance test is as close to real life as possible
- Make sure your performance tests are actually doing what you think they are!
- Use analytics tools like XRay to better understand your system
- Experiment and have fun! In AWS it’s fast and cheap to try things out.
- Once you’ve got your infrastructure as code set up (we use Terraform), deploying serverless applications in AWS is quick, cheap and easy which makes the cost of failure low.
- We even tried out running our stack in a different AWS region to compare network latencies – this was 1 line of Terraform code and a few minutes to deploy